Pew Research has released its latest report into social media usage among Americans, based on a survey of 5k people, which provides a general overview of social app usage trends, based on which apps people open regularly, as opposed to time spent.
Which would be a more valuable data point, but also a more difficult one to track. As such, Pew’s social media usage report is more of a general review of public usage, but not necessarily an indicator of popularity or engagement.
Take that as you will.
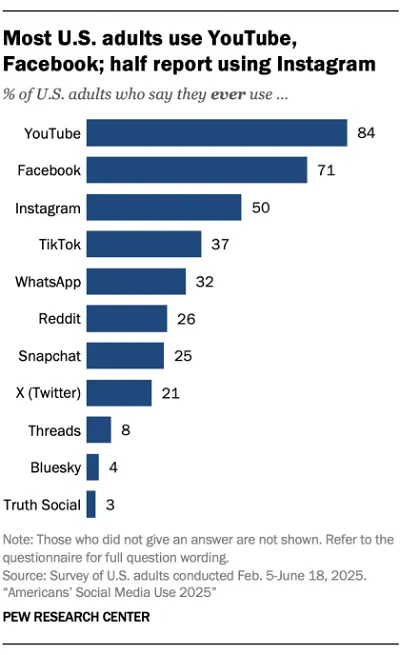
First off, on overall usage. Pew’s data shows that YouTube and Facebook continue to lead the way, with 71% of respondents indicating that “they ever use” the Facebook app.
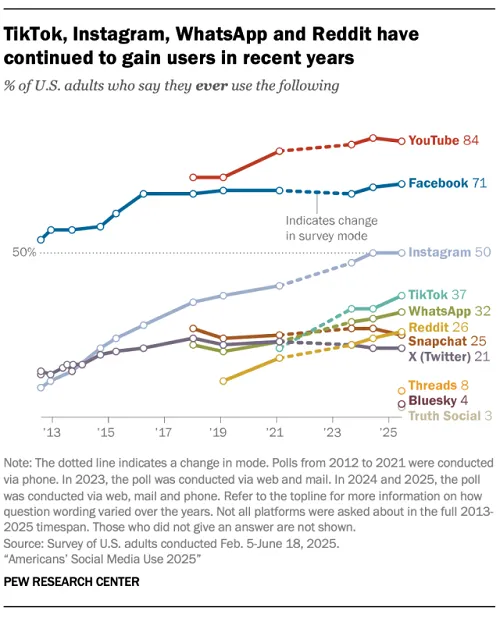
As you can see in this chart, YouTube, Facebook and Instagram lead the way in overall app usage, while TikTok, WhatsApp and Reddit have all seen a rise of late among U.S. users.
Though the question posed here is relevant. The specific question that respondents were asked doesn’t relate to preference, nor which platform you use more often, but only asks if you ever use any of these apps. In Facebook’s case, I suspect that this is an important factor, because while the data here would suggest that Facebook is the most popular social media app in the U.S., I assume that people actually spend a lot more time on TikTok or IG, though they do check into Facebook regularly.
We don’t have specific data on this, though another element of the Pew report does look at popularity, based on daily usage.
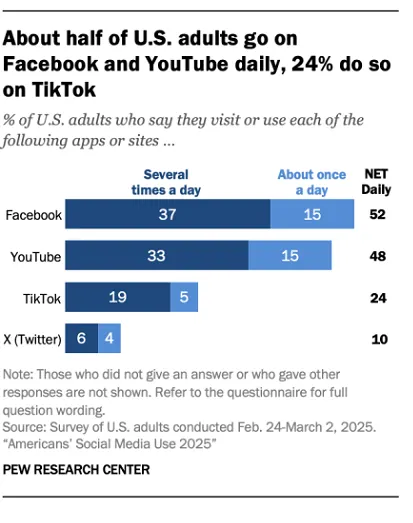
Though even then, the question doesn’t quite dig into usage time and popularity, with the question being “how often do you visit each app?”
Facebook has become a daily habit for checking in on the latest updates from friends and family, and as such, it’s no surprise that people are opening the app every day, while Facebook usage has also increased of late, based on it pumping more Reels into your feed.
But we don’t have specific data on Facebook time spent, which would be a more valuable indicator of actual popularity and relevance.
Though we do have a note on Threads usage in the report, the first time that Threads has been included:
As you can see in this chart, Pew’s data indicates that around 8% of respondents are now Threads users, versus 4% who use Bluesky (another newcomer to the listing), and 21% who use X.
Threads’ user count has been steadily rising, while X has seemingly lost ground with some users, though as you can see in the above graph, X has maintained its presence in Pew’s report. And overall, according to this survey at least, X is still a key resource for many Americans, with Threads still having some ground to catch up.
These trends, of course, would be different based on different audience groups, as 5k respondents is still only a fraction of the U.S. population. But as a general indicator, these graphs show overall interest, based on which social apps people ever use.
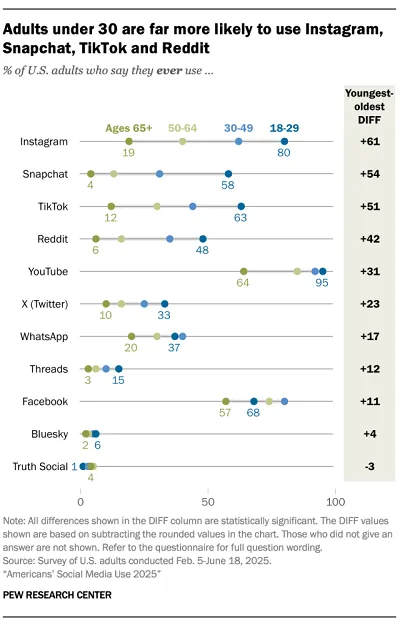
The report also looks at social media usage trends among younger users, with Instagram, Snapchat and TikTok leading the way.
The full report also includes insights into gender usage variances, political leaning, ethnicity, etc.
It’s an interesting indicator of overall trends, but again, without an actual measure of time spent in each app, I don’t think this is highly indicative of actual popularity.
You can check out Pew Research’s full report here.